

Soccer players repeatedly brake to press opponents, create separation, and change direction. Coaches need to understand how hard these actions are and how frequently athletes encounter them.
Greater maximal braking capacity could help athletes perform demanding decelerations more frequently. However, match output also depends on tactical responsibilities, movement opportunities, and approach speed.
The researchers investigated positional differences in deceleration profiles and whether higher peak deceleration was associated with more intense braking actions during matches.
Do players who record harder peak braking actions during a match also perform more high- and very high-intensity decelerations?
What Did the Researchers Do?
Study Design
The researchers monitored 24 professional female outfield players from one English Women’s Super League club during the 2021–2022 season.
- Players averaged 26.2 ± 3.8 years of age and 61.2 ± 5.4 kg in body mass.
- They collected 189 player-match observations across 27 matches, including only players who completed the entire match.
- Players wore GPS units, using the same device across matches.
Measurements
- Maximum deceleration, DMax ⮕ the highest deceleration magnitude recorded during each match.
- High-intensity decelerations, HID ⮕ the number of braking actions below −3 m/s².
- Very high-intensity decelerations, VHID ⮕ the number of braking actions below −4 m/s².
Recorded deceleration events had to last at least 0.5 seconds and reach a minimum magnitude of 0.5 m/s². VHID actions fall within the broader HID threshold, so the counts overlap.
What Were the Results?
Players averaged approximately 75 HID and 23 VHID actions per match.
Across the pooled observations:
- DMax averaged 6.03 ± 0.64 m/s².
- HID averaged 75.06 ± 20.13 actions.
- VHID averaged 23.09 ± 9.37 actions.
Higher DMax was associated with more intense braking actions.
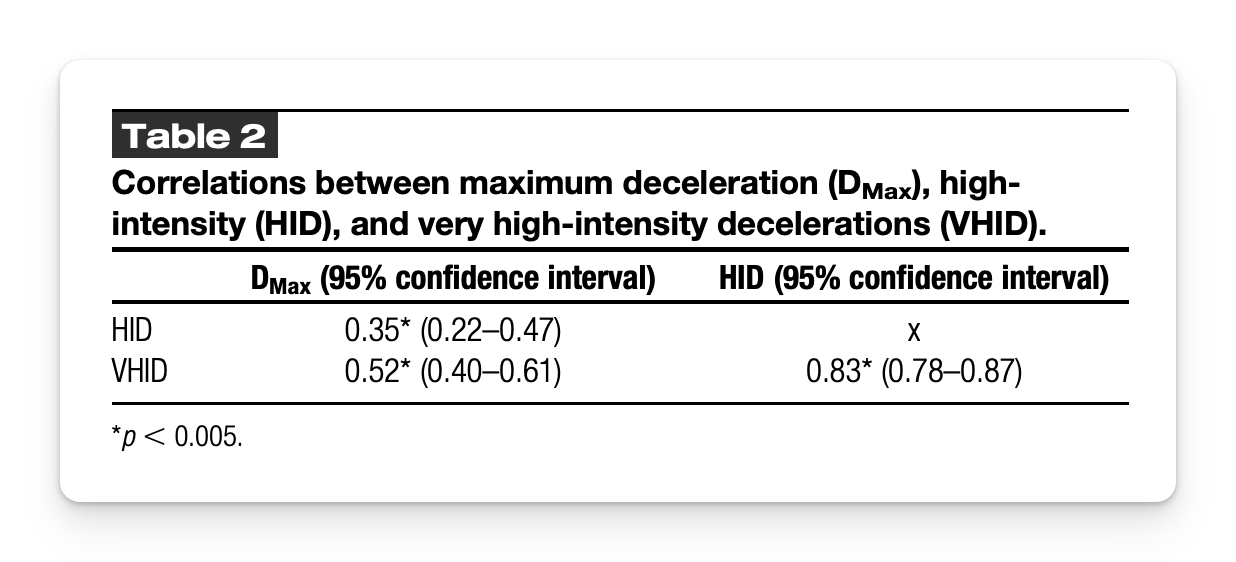
Higher DMax was moderately associated with more high-intensity decelerations (r = 0.35, 95% CI: 0.22–0.47), with a stronger relationship for very high-intensity decelerations (r = 0.52, 95% CI: 0.40–0.61). Both relationships were statistically significant (p < 0.005).
These correlations represent approximately 12% and 27% shared variance, respectively. They do not establish how much braking frequency was caused by physical capacity.
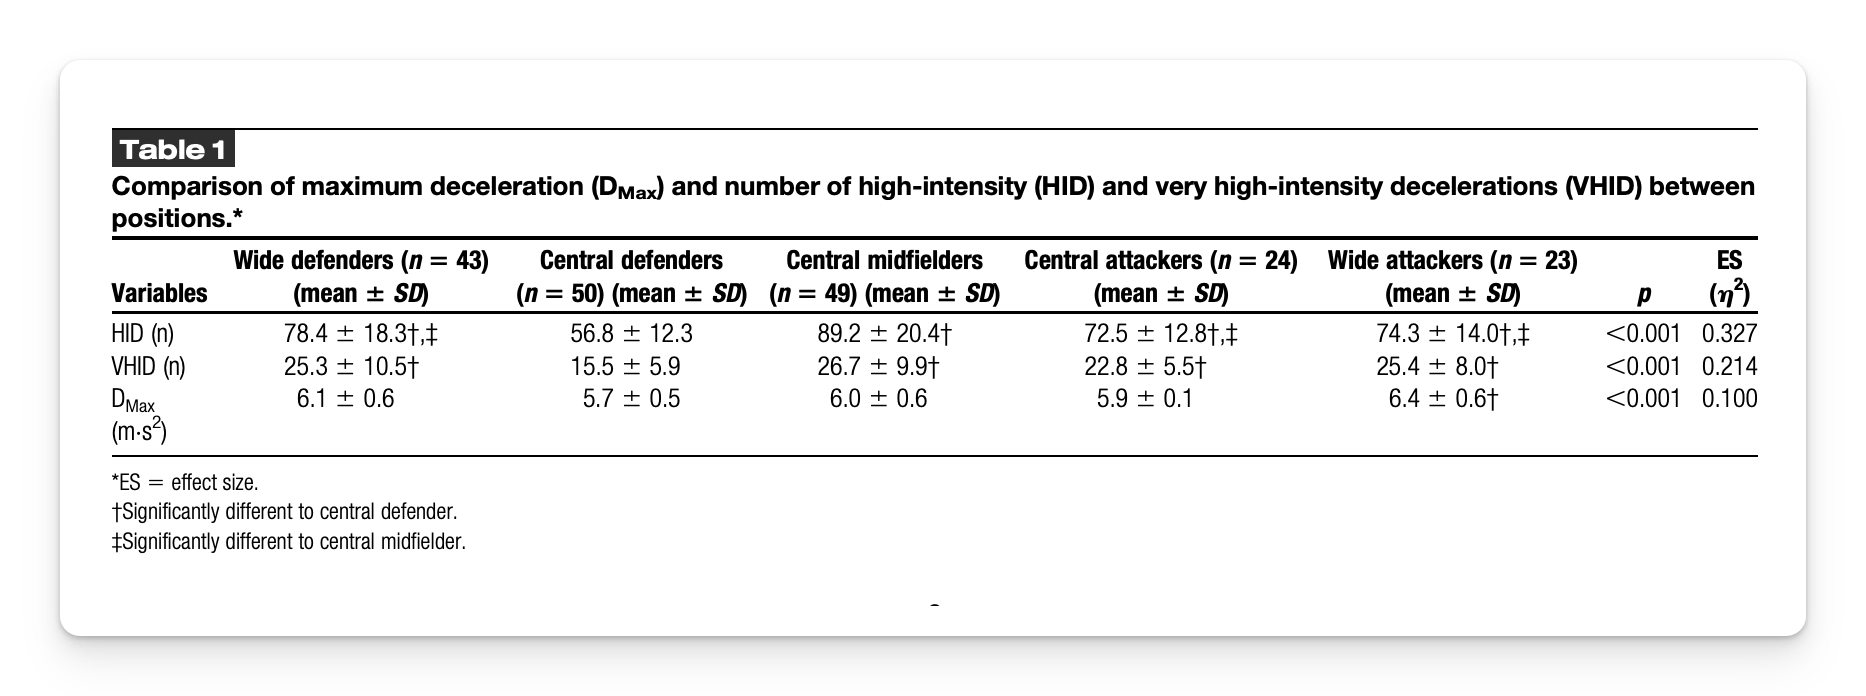
Braking demands differed by position.
- Central defenders ⮕ recorded the fewest intense braking actions, averaging approximately 57 HID and 16 VHID per match. Their average DMax was 5.7 m/s².
- Central midfielders ⮕ recorded the most HID, averaging approximately 89 HID and 27 VHID. Their average DMax was 6.0 m/s².
- Wide defenders ⮕ averaged approximately 78 HID and 25 VHID, with a DMax of 6.1 m/s².
- Central attackers ⮕ averaged approximately 73 HID and 23 VHID, with a DMax of 5.9 m/s².
- Wide attackers ⮕ recorded the highest average DMax, 6.4 m/s², alongside approximately 74 HID and 25 VHID.
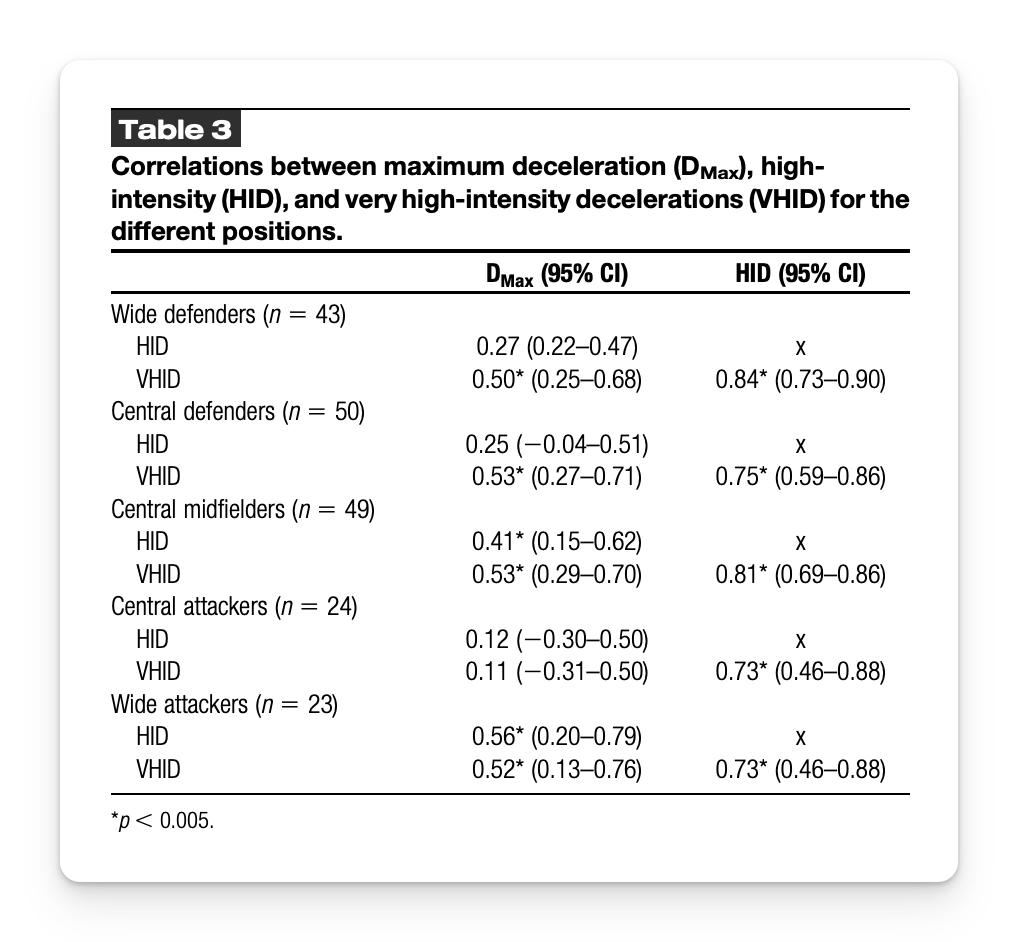
Relationships varied across positions and individuals.
The positional table reports DMax–VHID correlations around 0.50–0.53 for most positions, with a weaker relationship for central attackers, r = 0.11. The results narrative identifies wide attackers as the weaker group, contradicting the table.
Individual correlations ranged from negative to strongly positive. Differing, potentially small numbers of observations per player make those estimates difficult to interpret confidently.
What Does This Mean?
- Harder peak braking was associated with more frequent intense braking, particularly very high-intensity decelerations.
- Match output reflects capacity and opportunity. Tactical role, approach speed, and involvement in play influence braking demands, so lower match values do not establish inferior physical capacity.
- The physical explanation remains uncertain. Eccentric strength, reactive strength, and braking technique could contribute, but none were measured.
- Total counts tell us little about how efforts were repeated. Demanding decelerations spread across a match present a different challenge from several clustered efforts. The study did not distinguish these patterns.
Limitations
- GPS and thresholds affect interpretation ⮕ Brief decelerations may be captured inconsistently, while fixed thresholds represent different relative demands for different players.
- Generalizability is limited ⮕ This was one team, and only full-match appearances were included.
- Training effects and injury outcomes were not tested ⮕ The study cannot establish that improving DMax increases repeated braking performance or reduces injury risk.
Coach’s Takeaway
- Use match GPS to understand exposure ⮕ Interpret peak intensity and action counts alongside position, tactical role, and video before identifying a physical limitation.
- Standardize testing when capacity is the question ⮕ Keep approach speed, stopping task, surface, and measurement method consistent, then compare tested performance with match demands.
- Examine effort distribution when repeated braking is the concern ⮕ Consider clusters, recovery intervals, and changes in execution across efforts.
- Keep training claims proportional to the evidence ⮕ This study supports monitoring braking profiles. It provides no tested exercise prescription, training dose, or target DMax.
I hope this helps,
Ramsey
Reference
Martínez-Hernández, D., Jones, P. A., Oliva-Lozano, J. M., & Harper, D. J. (2026). Maximum Deceleration Is Related to Players’ Ability to Repeat High-Intensity Decelerations in a Match in Female Professional Soccer Players. Journal of Strength and Conditioning Research.


