

A new study breaks down early horizontal deceleration ability (see what I did there?)
The first contact begins while momentum is high (i.e. the most velocity since mass is constant). But by the third step, the athlete has more opportunity to adjust body position and direct force backward against the ground.
Hitchens and Verheul examined early deceleration and asked:
What separates athletes who reduce speed more effectively in the early steps of a planned stop, and does that answer change from step one to step three?
What did the researchers do?
Methods
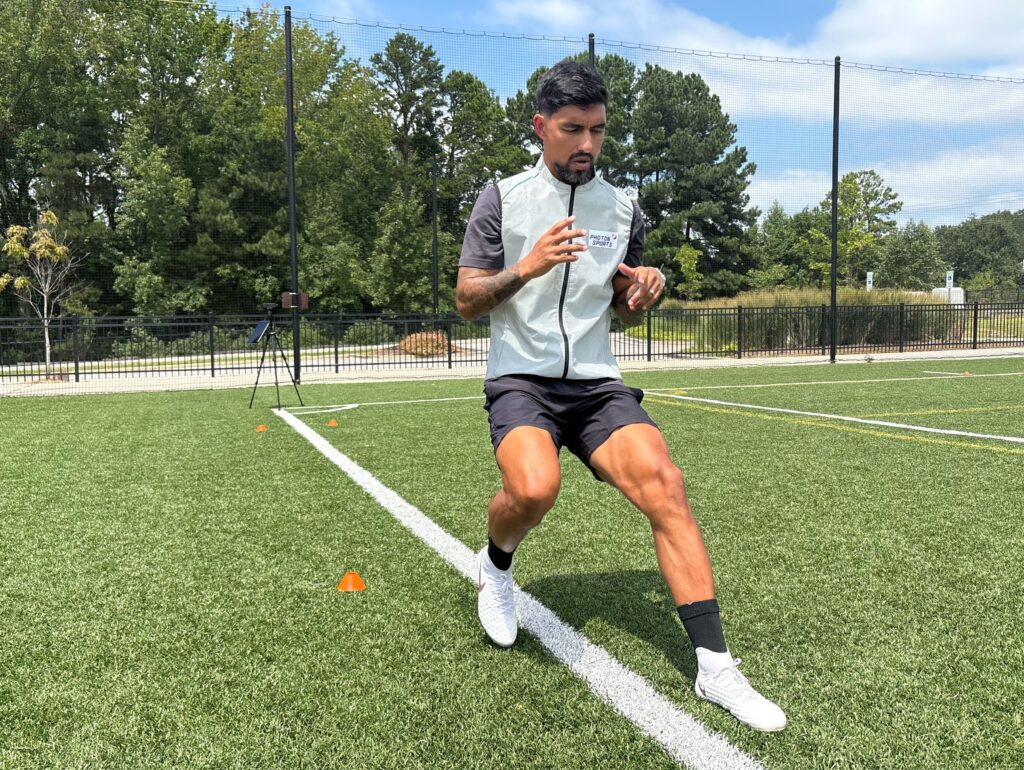
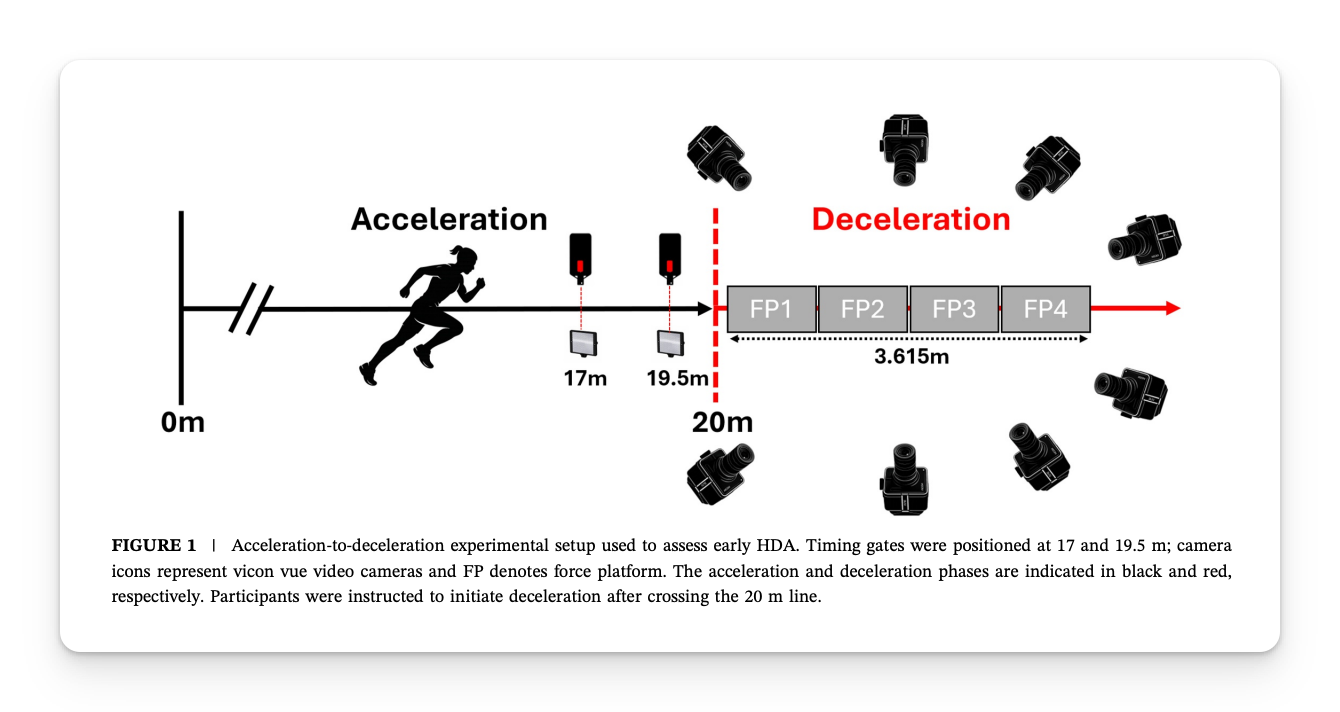
The researchers had 19 healthy team sport athletes (14 men, five women) accelerated for 20 m, then perform a maximal, preplanned stop in a straight line.
- Approach speeds: Five successful trials were targeted at each of three speeds: 100%, 85%, and 70% of maximal velocity.
- Actual average approach speeds: 7.09, 6.02, and 5.09 m/s at the 100%, 85%, and 70% targets, respectively.
- Trials analyzed: 256 of 285 recorded trials met the study criteria.
Measurements
Embedded force plates measured ground reaction forces, while markerless 3D motion capture estimated body and joint positions during the first three braking steps.
- Performance outcome: The rate of velocity reduction during each contact and from the first touchdown through the third toe-off, termed early horizontal deceleration ability.
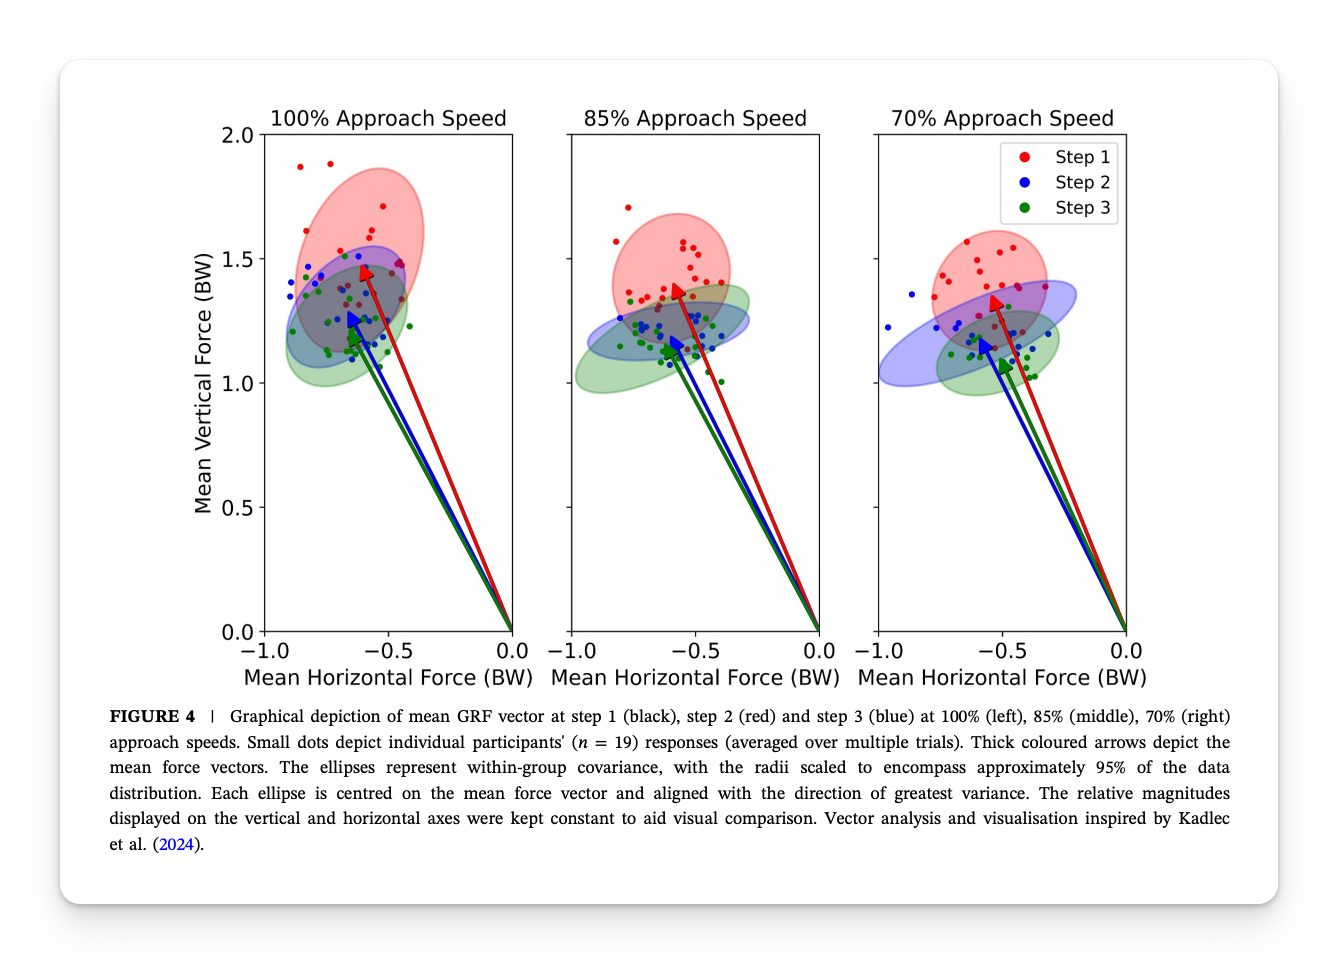
- Force variables: The magnitude of horizontal ground reaction force and its orientation relative to vertical force.
- Movement variables: Hip and knee flexion, center-of-mass height, foot position relative to the center of mass, and shank angle.
What were the results?
This is a bit dense but lots to unpack
The first braking step had a different force profile
- Mean horizontal braking force stayed relatively consistent across the first three steps.
- But athletes directed more force horizontally relative to vertically in steps two and three than in step one.
- Mean horizontal force in step one was the strongest step-specific force predictor of early deceleration across all three approach speeds. Force orientation had its strongest contribution in step three.
Athletes reduced more velocity after the first step
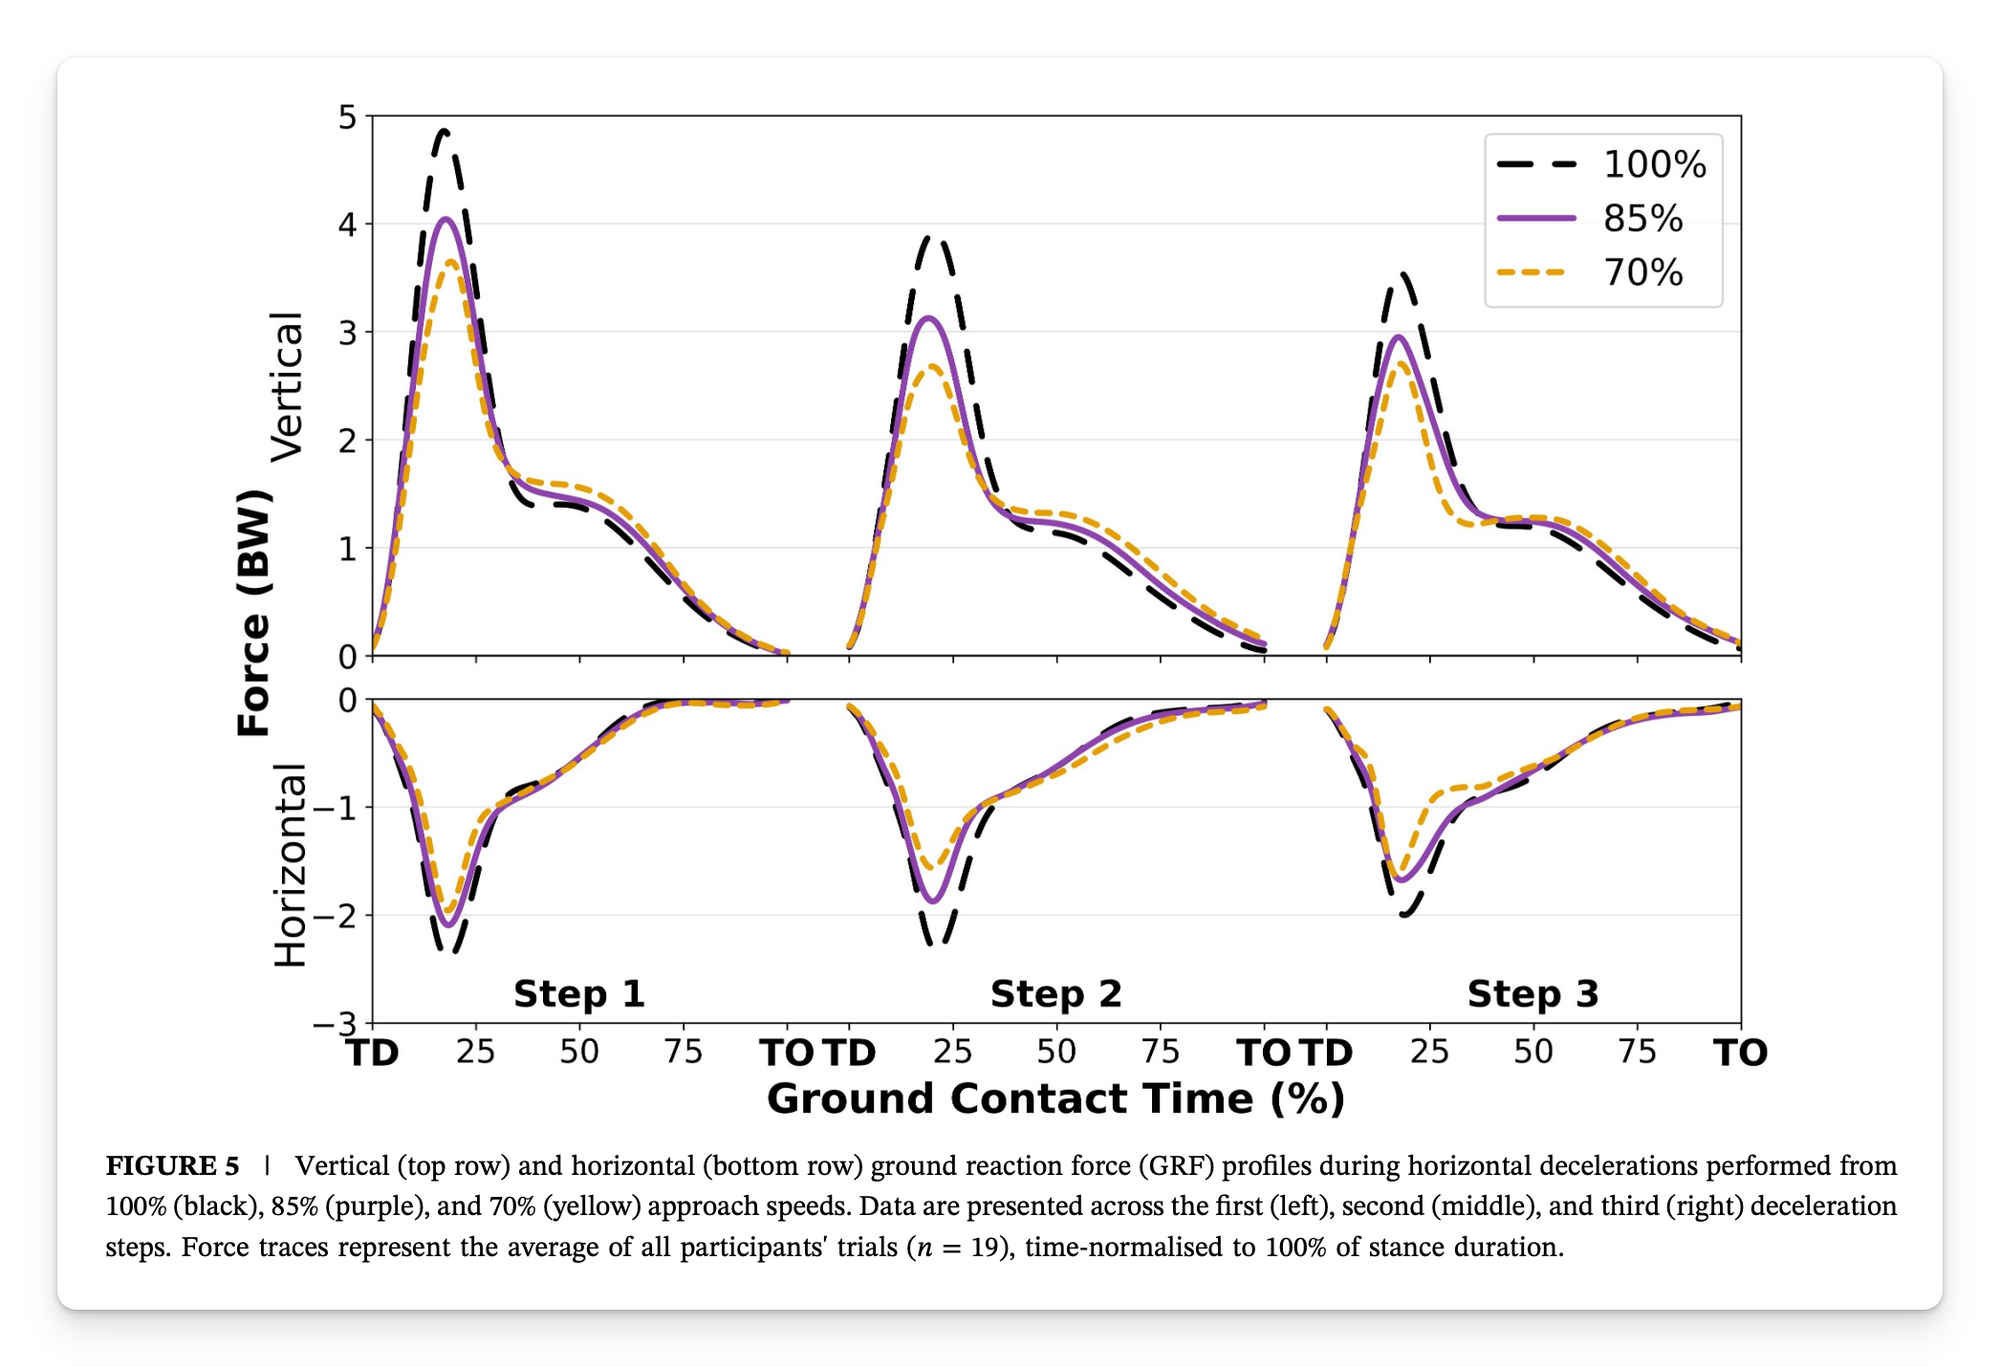
- Deceleration increased in step two and remained elevated in step three.
- The first contact appears to be a transition from sprinting into braking.
- Peak horizontal force remained elevated in steps one and two, then decreased in step three. Peak vertical force decreased across the steps.
The positions associated with force changed across steps
- In step one, greater peak hip and knee flexion during contact and a lower center of mass were associated with greater horizontal force and a higher horizontal-to-vertical force ratio.
- In steps two and three, touchdown position became more relevant. A lower center of mass, a foot farther ahead of the body, and a more negatively inclined shank were associated with the force measures.
- These position-to-force relationships were generally stronger at slower approach speeds. While they can guide coaching cues, its important to acknowledge
Submaximal stops still involved substantial forces
- Peak vertical ground reaction force averaged approximately 5.3 times body weight at 100%, 4.6 at 85%, and 4.1 at 70% approach speed.
- Faster approaches produced higher peak forces, even though slower approaches still created substantial external demands.
What does this mean?
- Step one begins at the highest momentum ⮕ Athletes who produced more horizontal braking force in that contact tended to slow more effectively across the first three steps.
- Flexion during step one was associated with force ⮕ Greater peak hip and knee flexion during contact related to the force measures.
- Touchdown position had clearer force relationships in steps two and three ⮕ A lower center of mass and particular foot and shank positions were associated with braking force and its orientation.
- Approach speed changes the task ⮕ Position-to-force relationships were generally stronger at slower speeds, so mechanics seen in a slower stop may not carry over to a faster one.
- Submaximal stops still produced substantial external forces ⮕ The study measured forces at 70% and 85% approach speeds, but did not test fatigue, tissue loading, or training adaptations.
Limitations
- The study identifies positions seen alongside particular forces. It cannot show that cueing those positions will increase braking ability or that one technique is best for every athlete. That data is always hard to get and takes time.
- Athletes knew they would brake after 20 m. Reactive stops, cutting, and decisions made around an opponent may produce different patterns.
- Faster early braking may matter, but the study did not establish how these findings affect complete stopping distance, change-of-direction performance, let alone game actions.
Coach’s takeaway
- Film the sequence, not one still frame ⮕ Watch how the athlete enters the stop, absorbs the first contact, and organizes the next two.
- Practice stops from several approach speeds ⮕ A slower approach can give an athlete room to work on positions; faster approaches test whether those positions remain usable under greater momentum.
- Treat cues as experiments ⮕ If you cue more flexion or a different touchdown position, check whether the athlete actually stops more effectively.
I hope this helps,
Ramsey
Reference: Hitchens, L., & Verheul, J. (2026). “Early Horizontal Deceleration Ability Across Multiple Steps and Approach Speeds in Multidirectional Team Sport Athletes.” European Journal of Sport Science, 26, e70224.


