

Coaches chase speed through strength and power work.
The relationship is real, but not linear forever. At some point, “more” stops moving the sprint needle.
This study used machine learning to model when common tests stop predicting faster 20 m and 40 m sprint times in trained footballers, giving coaches thresholds to guide programming focus.
And the punchline: strong enough is not that strong (read on to learn why).
Master Performance Coaching & Elevate Your Career in Just 6 Weeks with a Global Community of Professionals
At what levels of strength and power do gains stop transferring meaningfully to 20–40 m sprint speed for trained team-sport athletes?
What Did the Researchers Do?
Study Design
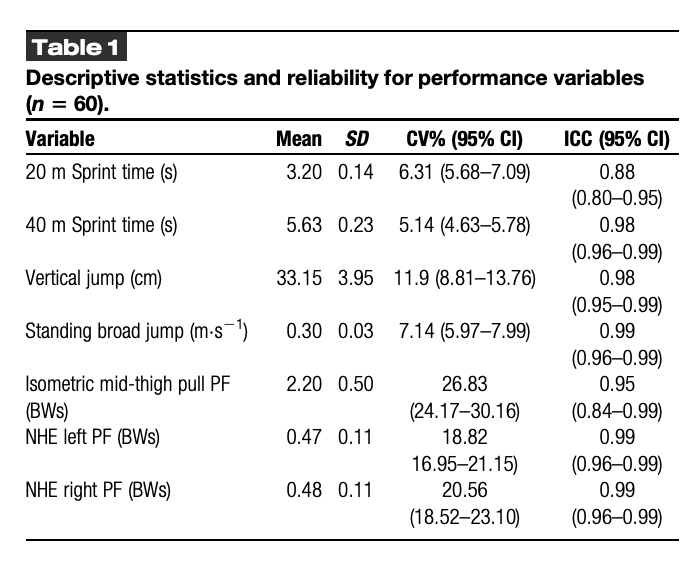
- 60 male National Premier League footballers injury-free ≥6 months. Age ~18 years.
- Sprints: 3 × 40 m indoors with timing gates, best 20 m and 40 m times used.
- Strength/Power: IMTP peak force (relative to BW), standing broad jump (SBJ) horizontal impulse normalized to body mass, CMJ height, Nordic hamstring peak force (left/right, relative).
- Force plates used for CMJ and SBJ; NordBord for Nordic; custom rig for IMTP.
Statistical Analysis
- Random forest regression with 5-fold CV to predict 20 m and 40 m times.
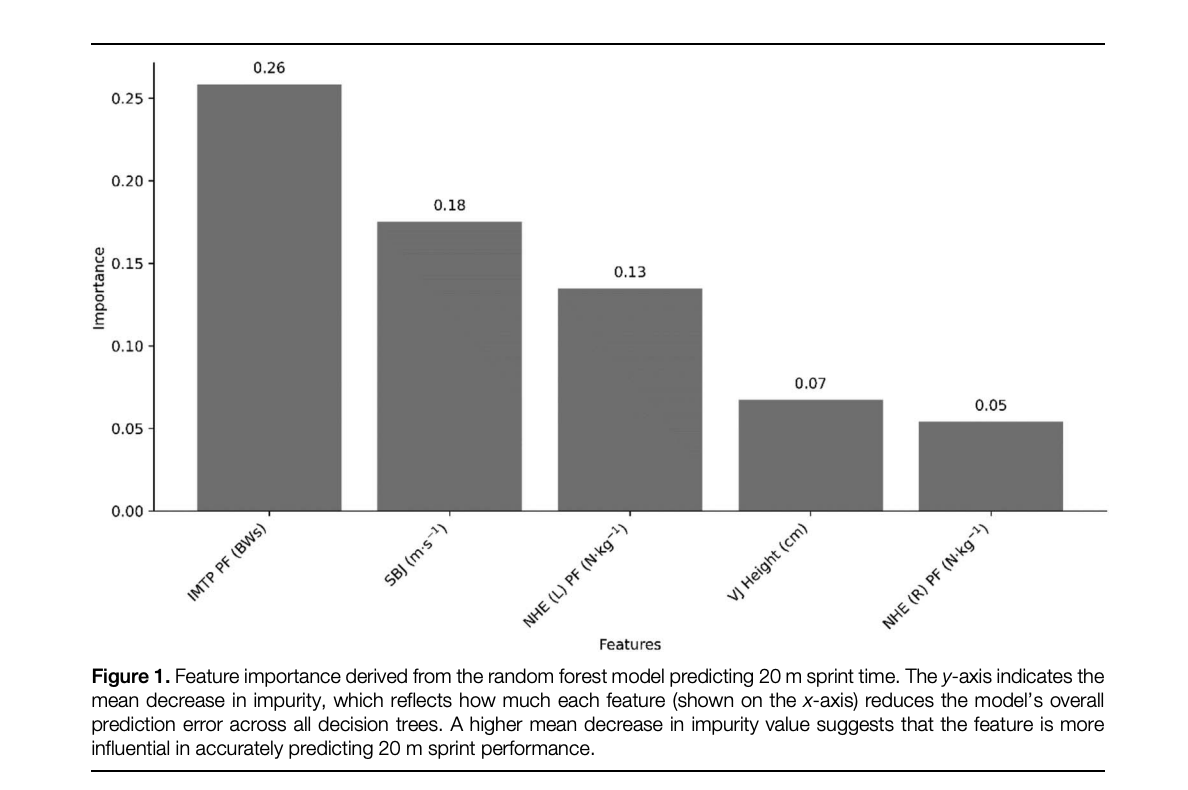
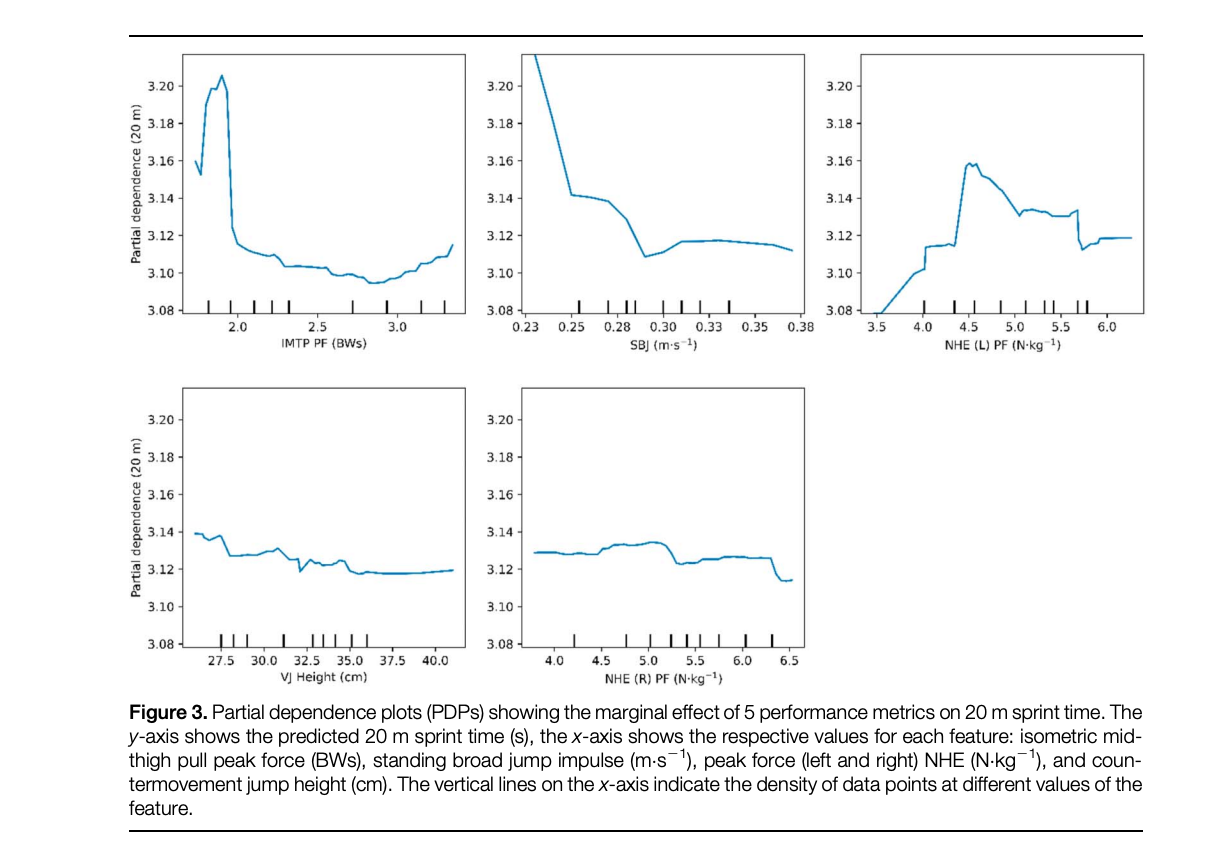
- Feature importance and partial dependence plots (PDPs) identified “saturation points” where more of a capacity gave little added sprint benefit.
What were the results?
The model has strong predictive power for sprint times (R² ≈ 0.85–0.87).
Top Predictors
- IMTP peak force (×BW) and SBJ impulse (m·s⁻¹) were best predictors.
- CMJ height and Nordic strength were less predictive in this cohort.
Saturation Thresholds
- IMTP ≈ 2.0 × body weight → added strength beyond this point showed diminishing returns for 20 m and 40 m speed.
- SBJ impulse ≈ 0.29 m·s⁻¹ → similar leveling off beyond this value.
Phase Insight
- Despite different ground reaction force orientations in acceleration vs max velocity, IMTP and SBJ predicted both phases similarly in this team-sport sample.
What Does This Mean?
- If an athlete is under ~2.0× BW IMTP or ~0.29 m·s⁻¹ SBJ impulse, improving these will likely translate to faster sprints.
- Additional raw strength or horizontal impulse beyond these thresholds yield smaller sprint dividends.
- Context matters and these cut points reflect trained footballers, not elite sprinters or youth novices.
Limitations
- Cross-sectional: Thresholds inferred from one time-point. We still need longitudinal proof that crossing these thresholds changes sprint outcomes within individuals.
- Population-specific: Team-sport athletes, not track sprinters. Thresholds likely differ across sports, sexes, ages, and training ages.
Coach’s Takeaway
- Prioritize progress to clear strength/power floors ⮕ Push IMTP toward ~2.0× BW and SBJ impulse toward ~0.29 m·s⁻¹ for likely speed gains.
- Then reallocate training ⮕ Past those marks, invest more in sprint mechanics, frequent exposures, wicket runs, sleds tuned to phase, and micro-dose top speed.
- Re-test quarterly to track IMTP and SBJ vs 20/40 m ⮕ Let your own PDP-style snapshots tell you when to pivot the plan.
I hope this helps,
Ramsey
Reference:
Vial S, Scanlan M, Beranek P, Kadlec D, Barley OR, Cochrane Wilkie J. (2025). How strong is strong enough? Assessing when physical performance tests cease to be predictive of sprint performance in trained football players. Journal of Strength & Conditioning Research


