

Understanding Ratio Data
Ratio data are everywhere in strength and conditioning, even if we don’t always think of them that way. When a coach evaluates an athlete’s Reactive Strength Index (RSI), Dynamic Strength Index (DSI), or Hamstring-to-Quadriceps (H:Q) ratio, they are using ratio data.
These ratios aim to simplify complex information and make comparisons more straightforward by combining two or more measurements into a single number. The problem is that by compressing two independent variables into one, we can often lose context or even misinterpret the results.
As Bishop (2025) puts it, ratio data are “made up of more than one component part,” and understanding those parts is key to using the data effectively.

The Simplest and Fastest Way to Learn Jump Analysis with Force Plates
What Are Common Ratio Metrics?
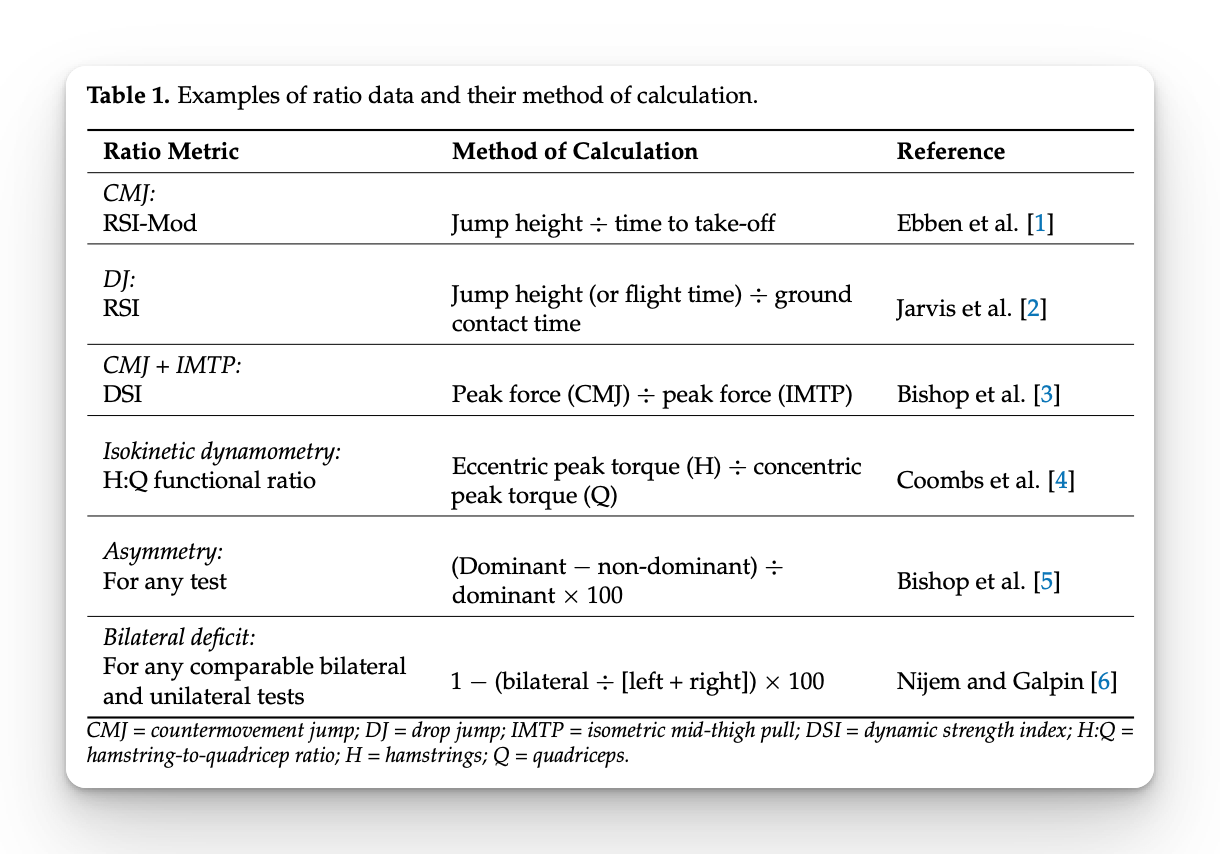
The most frequently used ratios in sport science are listed in Table 1 below and include RSI, RSI-Mod, DSI, and other asymmetry measures. These ratios are useful because they normalize data, allowing comparisons between limbs, muscle groups, or testing modes.
But the simplicity comes at a cost. When two measures are combined, their individual measurement errors also combine, often reducing the reliability of the final value.
The Problem of Compounded Error
All performance tests carry some level of error, whether due to the equipment, testing environment, or athlete variability. When we form a ratio from two such measures, those errors are multiplied. This can make ratio-based metrics less reliable than their components.
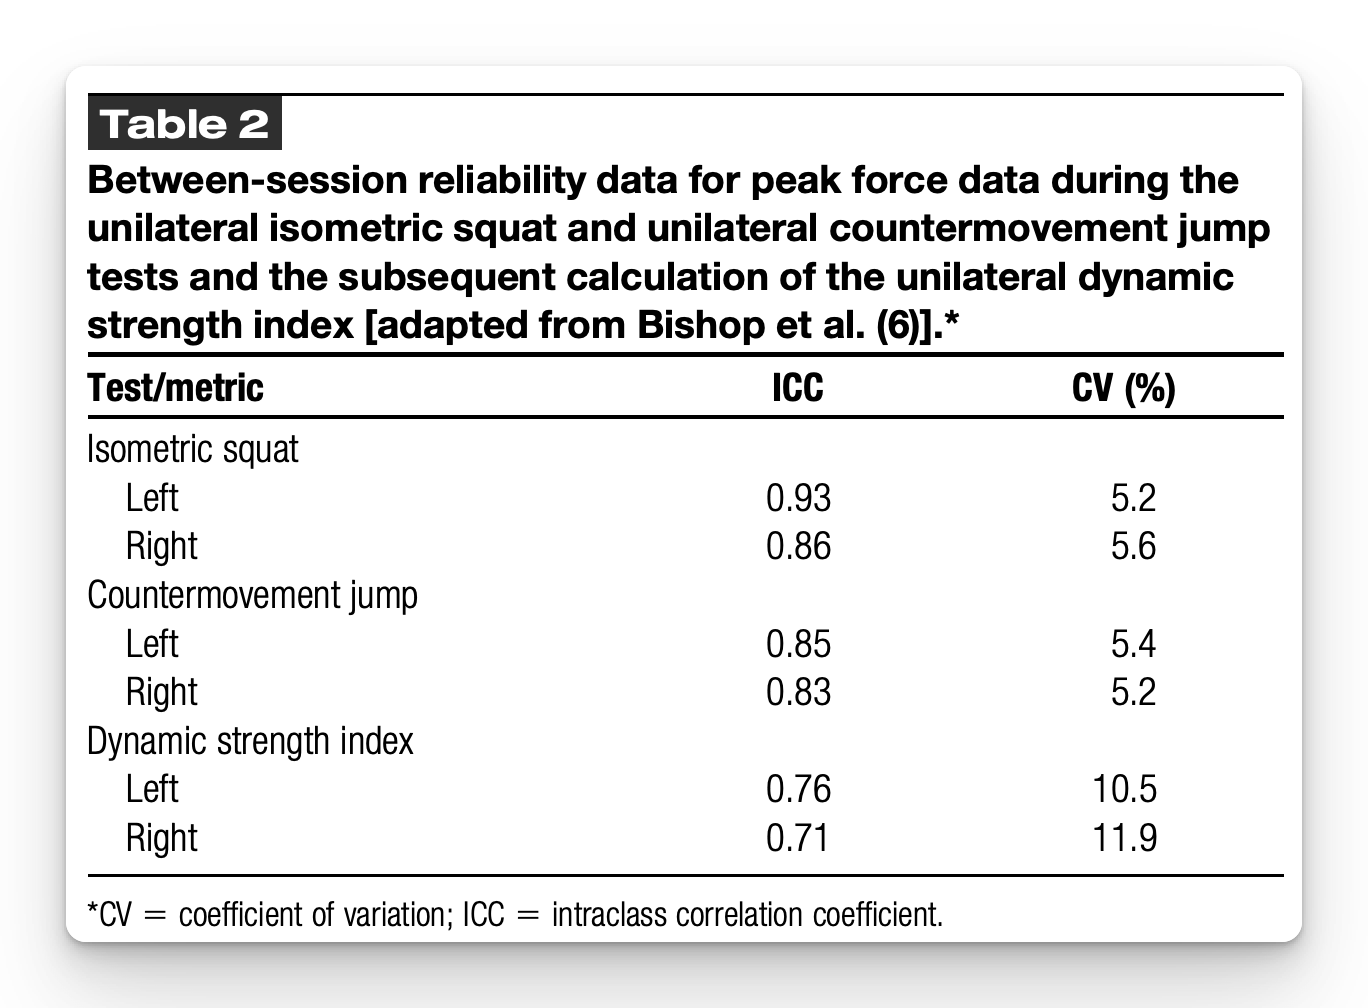
For example, in Bishop’s (2025) analysis of the unilateral Dynamic Strength Index, reliability dropped when compared to the underlying tests (Table 2). The DSI had nearly twice the variability of its component tests. In practice, this means that apparent changes in DSI over time may reflect measurement noise rather than meaningful adaptation.
Why Component Parts Matter
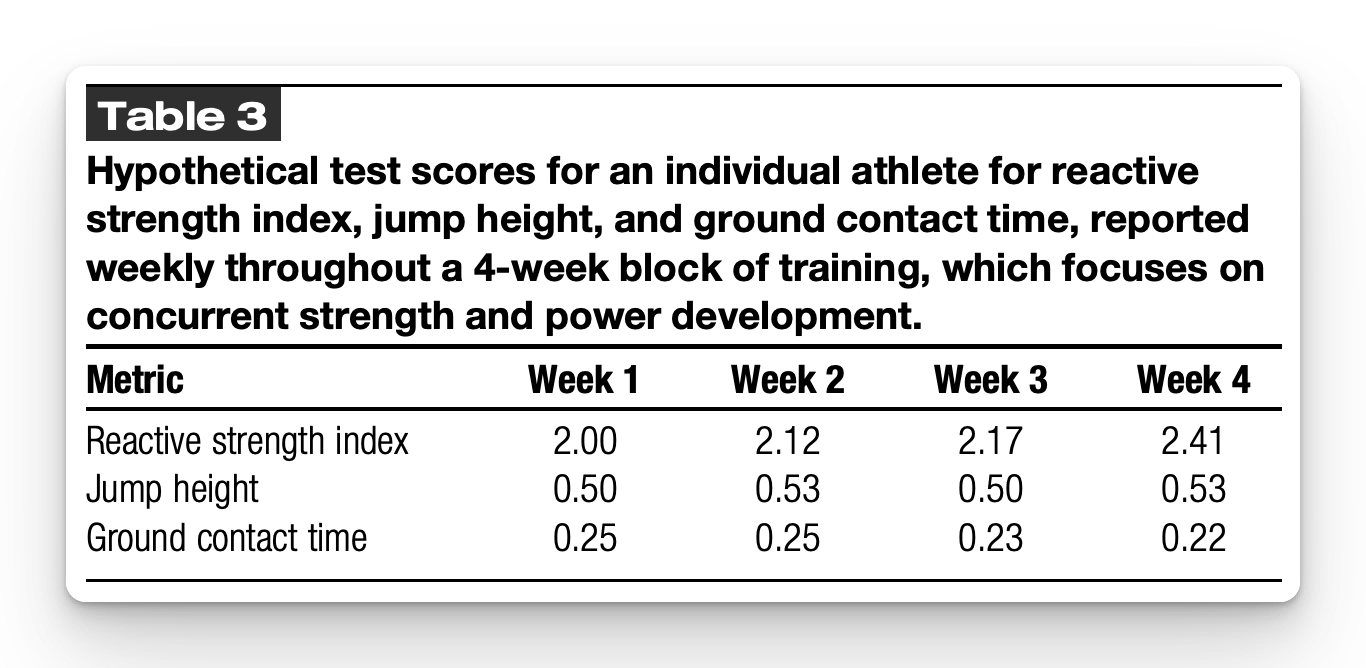
To see how easily ratios can mislead, consider the example of the Reactive Strength Index. The RSI is calculated by dividing jump height by ground contact time. If a coach tracks RSI over a training block and sees it improving each week, that seems positive. But unless they also examine jump height and contact time individually, they may misinterpret the change.
Table 3 presents a hypothetical example, where RSI improved each week, but the reasons differed. In week two, jump height increased; in week three, the improvement came from shorter ground contact time; in week four, both improved. Without tracking the components, a coach could easily miss whether an athlete was becoming more powerful, more reactive, or simply changing jump strategy.
The Hidden Risks of Symmetry Ratios
Another example lies in inter-limb asymmetry. Figure 1 in Bishop (2025) shows that when asymmetry values are presented only as percentages, it can appear that athletes are becoming more symmetrical over time.
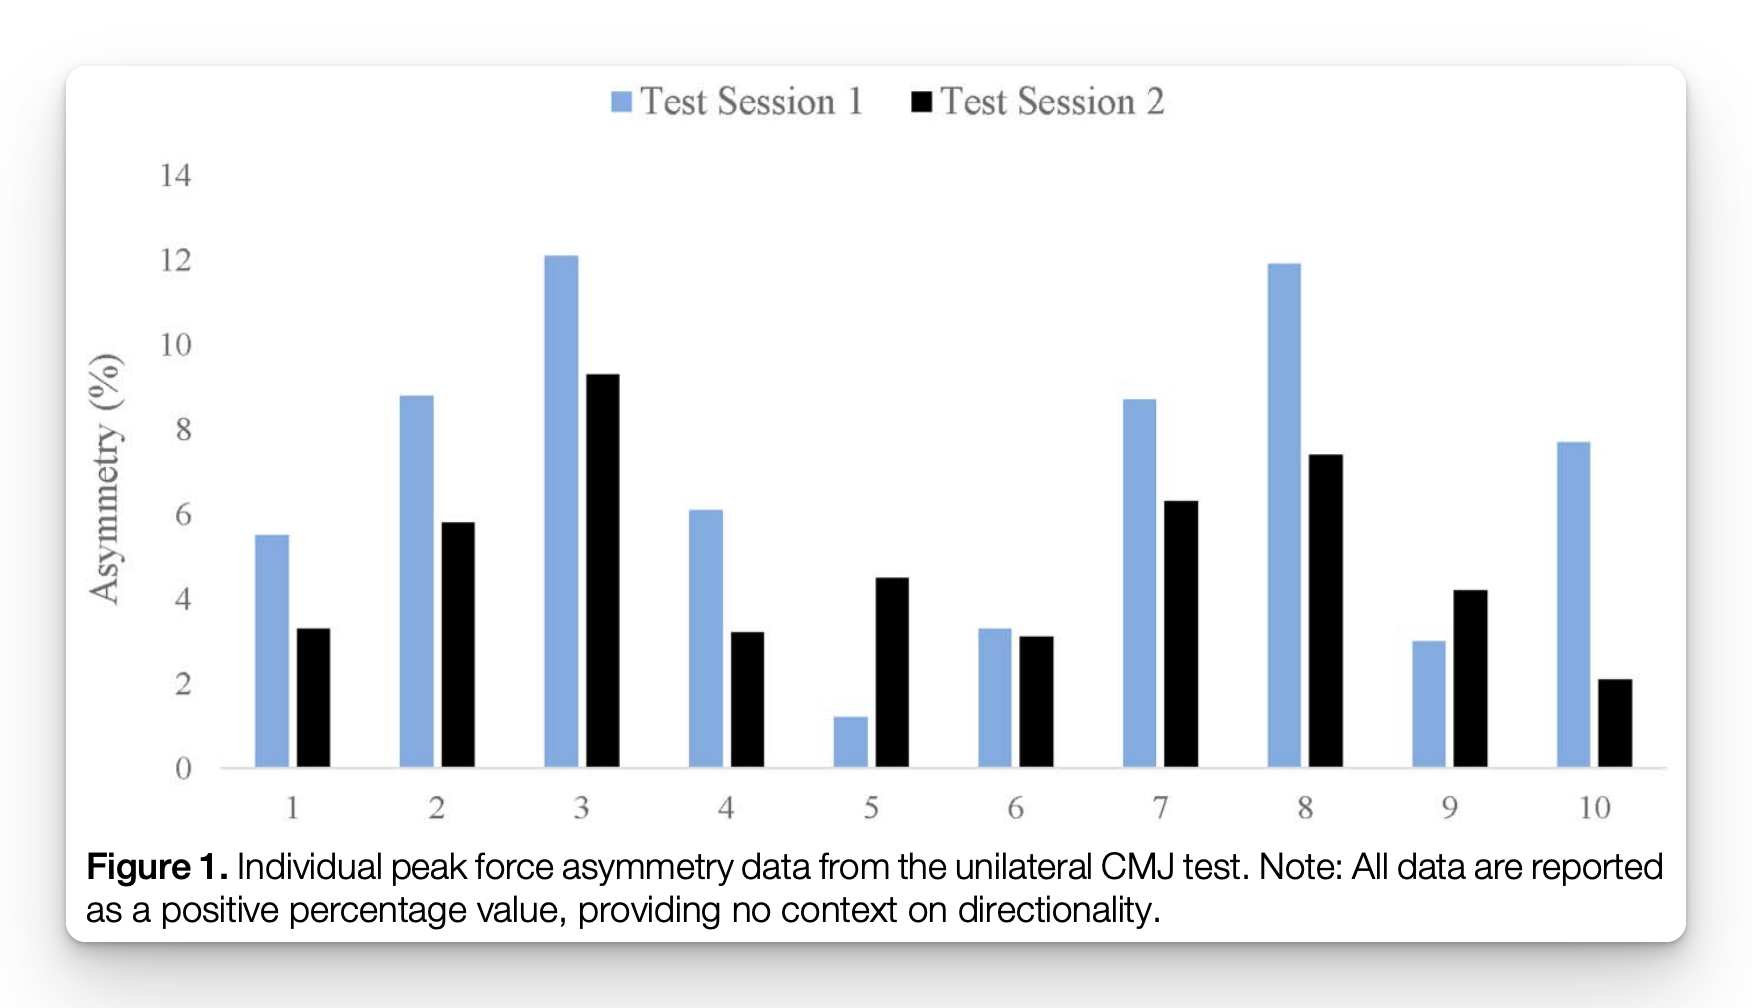
But when directionality is included (as in Figure 2), we see that some athletes actually switched which limb was dominant. What looks like a 2% reduction in asymmetry could actually mask an 8% change in limb dominance.
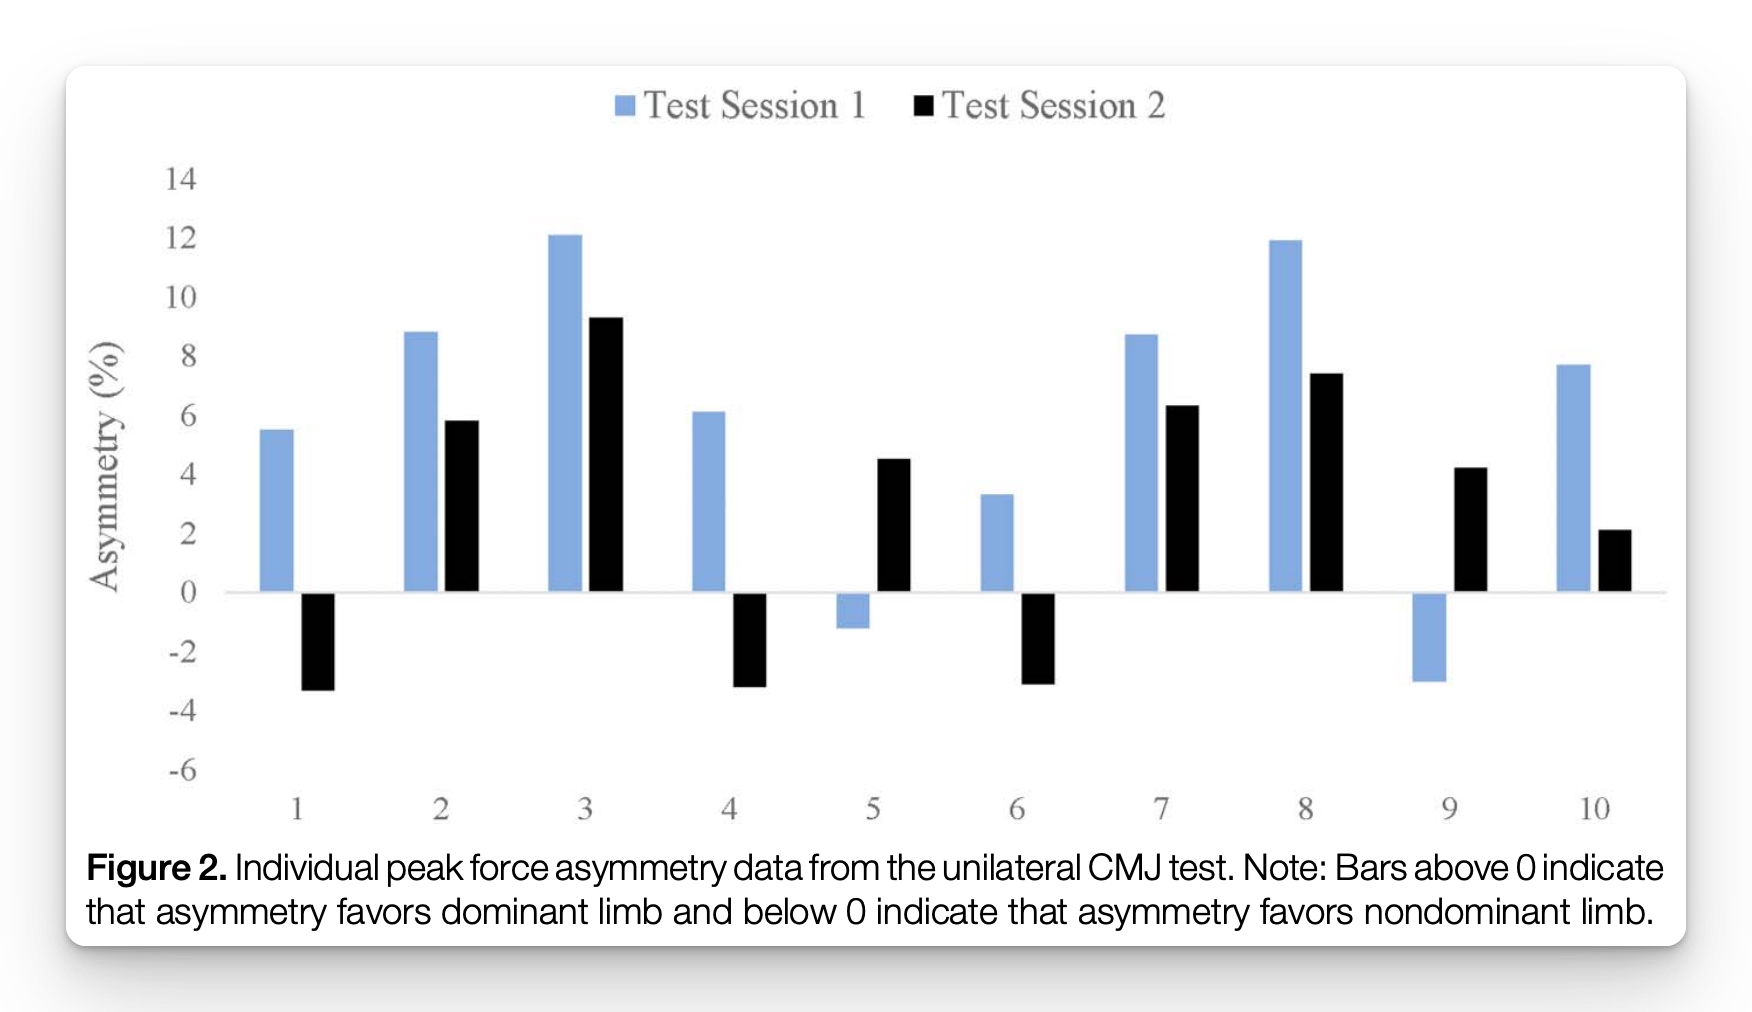
This illustrates why relying on ratios alone can be problematic, particularly in return-to-play or injury prevention settings. Improved symmetry might mean either that the weaker limb has strengthened or that the stronger limb has weakened; two very different interpretations.
Ratio vs Component Parts
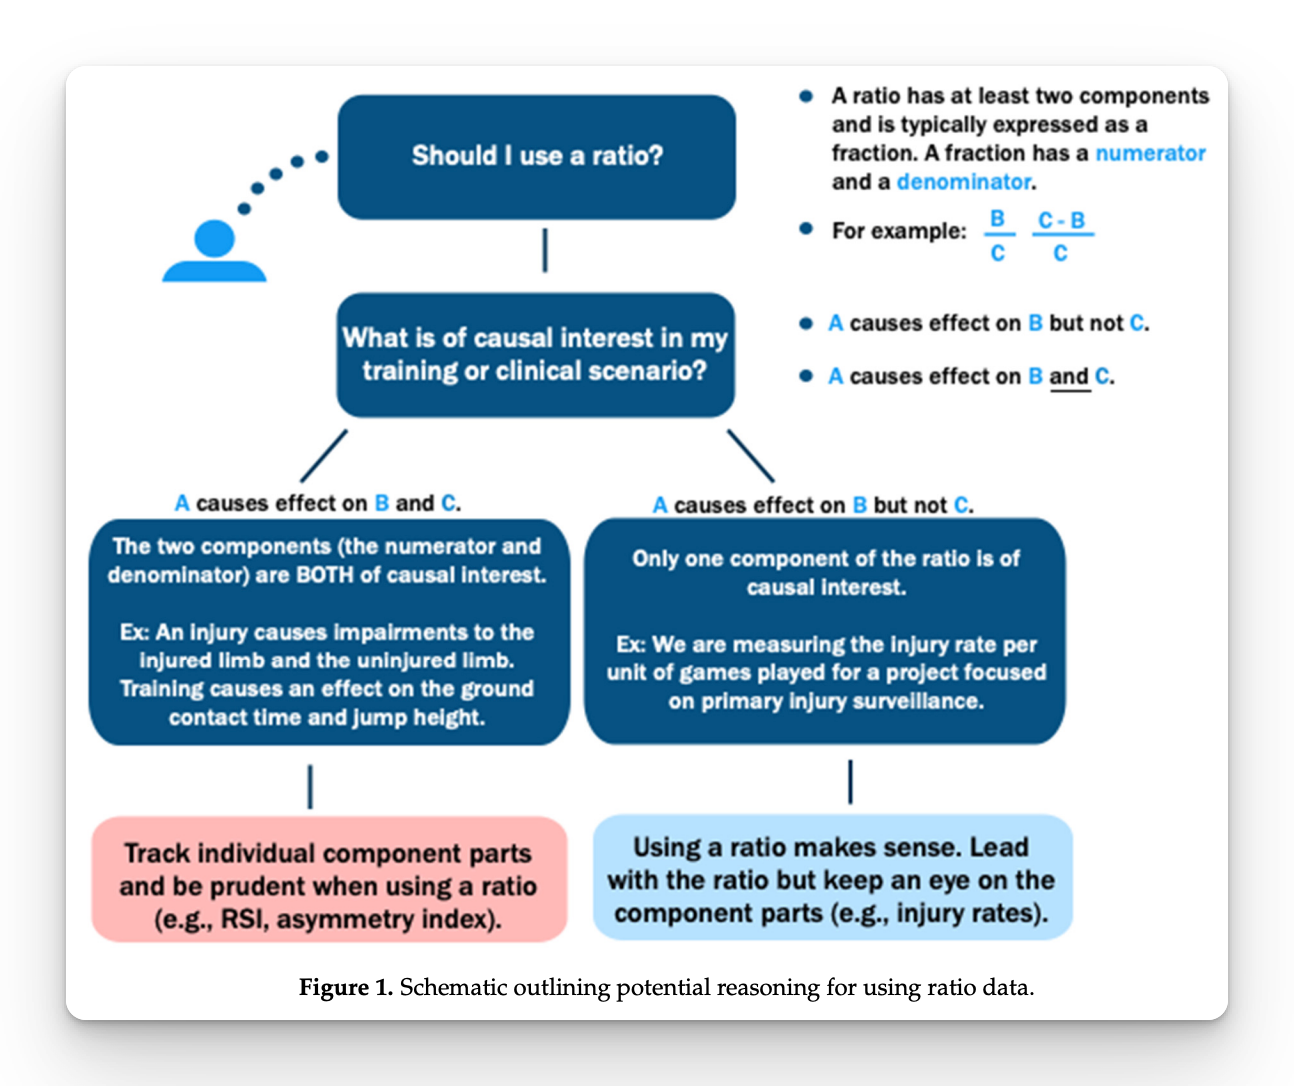
Figure 1 from Bishop and colleagues (2023) provides potential reasoning for using ratio data.
If both parts of the ratio change, like when training influences both jump height and ground contact time, using a ratio can be misleading. In these cases, track the parts rather than relying solely on the combined ratio.
However, if only one part is affected, the ratio can be meaningful. For example, injury rate per game makes sense because the number of games doesn’t influence injuries.
In short, ratios work when one component provides stable context, but when both parts move, monitor each individually.
How to Use Ratio Data Effectively
To make ratio data meaningful in applied settings, coaches should follow several principles:
- Always monitor the component parts ⮕ If you’re tracking RSI, you must also examine jump height and ground contact time. If you’re monitoring H:Q, you must know whether changes are coming from the hamstrings, quadriceps, or both.
- Consider reliability first ⮕ A ratio built from unreliable tests will amplify noise, not insight.
- Interpret ratios in context ⮕ Use them as summary indicators, supported by the raw data that created them.
Key Takeaways for Coaches
Ratio data can simplify analysis, but they can also conceal the story behind an athlete’s progress. Every ratio is only as good as the component parts that create it.
Always check whether those parts are reliable, whether they are changing in meaningful ways, and whether the ratio itself adds value beyond simply tracking each measure independently.
I hope this helps,
Ramsey
References:
- Bishop, C., Shrier, I., & Jordan, M. (2023). Ratio Data: Understanding Pitfalls and Knowing When to Standardise. Symmetry, 15(318).
- Bishop, C. (2025). Using Ratio Data in Strength and Conditioning: Component Parts Hold the Key. Journal of Strength and Conditioning Research, 39(2), e176–e179.


