Athletes often struggle to regain full function after ACL reconstruction (ACLR), even when strength returns.
Traditional strength tests may overlook key neuromechanical deficits, particularly those related to jumping mechanics.
This study explored whether inefficiencies in countermovement jump (CMJ) performance post-ACLR are caused by persistent quadriceps weakness or if other biomechanical inefficiencies are at play.
What are the CMJ and quad deficits after ACL reconstruction?
What Did the Researchers Do?
The researchers had 22 athletes post-ACLR (10 months out) and 12 matched healthy controls perform isokinetic and jump testing.
Testing
- Isokinetic quadriceps strength at 60°/s and 180°/s
- Bilateral & unilateral CMJs on dual force plates
Metrics
- Ground reaction forces (GRF) in 3 jump phases:
- Unweighting
- Braking
- Propulsion
- Jump height & reactive strength index (RSI)
- Between-limb asymmetries
What Were the Results?
Bilateral CMJ Deficits (4 of 6 Metrics)
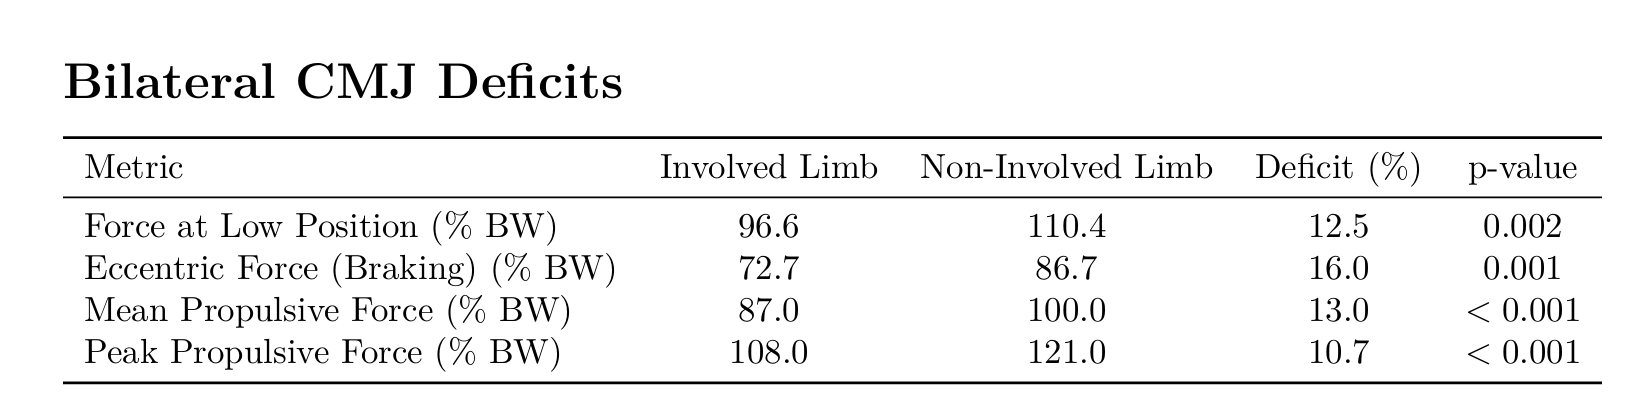
Compared to the non-involved limb, the ACLR leg showed significant deficits in:
- Force at low position:
- Involved: 96.6% BW
- Non-involved: 110.4% BW
- Deficit: 12.5% (p = 0.002)
- Eccentric force (braking):
- Involved: 72.7% BW
- Non-involved: 86.7% BW
- Deficit: 16% (p = 0.001)
- Mean propulsive force:
- Involved: 87.0% BW
- Non-involved: 100.0% BW
- Deficit: 13% (p < 0.001)
- Peak propulsive force:
- Involved: 108.0% BW
- Non-involved: 121.0% BW
- Deficit: 10.7% (p < 0.001)
Other CMJ observations
- Only 9% of ACLR athletes showed peak force at the bottom of the countermovement (vs. 25% in controls)
- RSI was 28% lower in ACLR athletes (p = 0.002)
- No between-limb deficits in controls
Unilateral CMJ Deficits (10 of 15 Metrics)
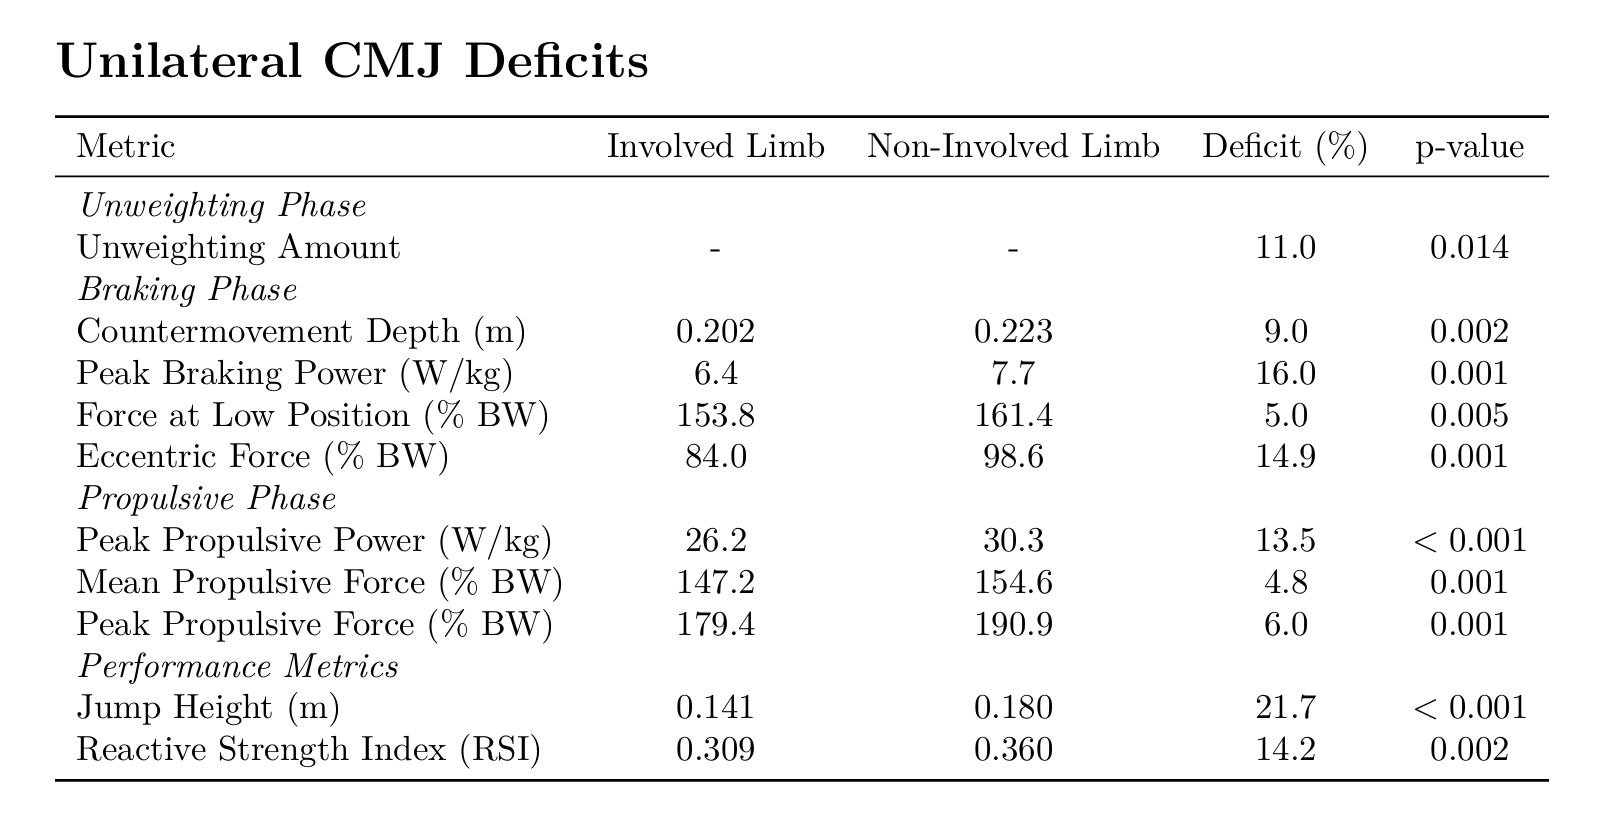
The involved limb was significantly worse in:
Unweighting Phase
- Unweighting amount:
- 11% lower (p = 0.014)
Braking Phase
2. Countermovement depth:
- Involved: 0.202 m
- Non-involved: 0.223 m
- Deficit: 9% (p = 0.002)
- Peak braking power:
- Involved: 6.4 W/kg
- Non-involved: 7.7 W/kg
- Deficit: 16% (p = 0.001)
- Force at low position:
- Involved: 153.8% BW
- Non-involved: 161.4% BW
- Deficit: 5% (p = 0.005)
- Eccentric force:
- Involved: 84.0% BW
- Non-involved: 98.6% BW
- Deficit: 14.9% (p = 0.001)
Propulsive Phase
6. Peak propulsive power:
- Involved: 26.2 W/kg
- Non-involved: 30.3 W/kg
- Deficit: 13.5% (p < 0.001)
- Mean propulsive force:
- Involved: 147.2% BW
- Non-involved: 154.6% BW
- Deficit: 4.8% (p = 0.001)
- Peak propulsive force:
- Involved: 179.4% BW
- Non-involved: 190.9% BW
- Deficit: 6% (p = 0.001)
Performance Metrics
9. Jump height:
- Involved: 0.141 m
- Non-involved: 0.180 m
- Deficit: 21.7% (p < 0.001)
- Reactive Strength Index (RSI):
- Involved: 0.309
- Non-involved: 0.360
- Deficit: 14.2% (p = 0.002)
The control group showed no significant differences between dominant and non-dominant limbs in any metric.
What Does This Mean?
CMJ deficits post-ACLR are not explained by quad strength alone.
Most braking and unweighting phase inefficiencies reflect stretch-shortening cycle dysfunction, not muscular weakness.
Propulsive phase metrics were moderately correlated with isokinetic power (especially at 180°/s), suggesting some connection to strength, but it's not the whole story.
Coach’s Takeaway
Jump Testing Reveals More Than Strength Tests Alone
- Add force plate CMJs (especially unilateral) to your RTP battery.
Train SSC Function, Not Just Strength
- Use plyometrics that emphasize deceleration, braking, and timing of force application.
Even “Strong” Athletes May Have Hidden Deficits
- Strength numbers may be fine, but performance and injury risk are still compromised if they can’t coordinate the SSC efficiently.