

Collegiate football athletes train in highly structured environments with robust strength and conditioning (S&C) and nutrition support.
Coaches expect steady progress, but the rate of improvement often slows with time.
The aims of this study were 2-fold:
- 1) Describe four-year changes in strength, power, speed, and body mass by position.
- 2) Quantify year-over-year rates of change to test the “law of diminishing returns.”
How much do D1 football players actually improve each year in strength/power/speed/body mass, and when do those gains start to slow?
Master Performance Coaching & Elevate Your Career in Just 6 Weeks with a Global Community of Professionals
What Did the Researchers Do?
Researchers performed a retrospective analysis of 15 years of testing data from a single D1 program; 512 athletes, 2,628 observations.
Positions
- 11 positional groups (e.g., OL, DL, LB, WR, CB, RB, TE, QB, S, specialists).
- Athletes remained in their assigned group for analysis.
Tests
- Strength: 1RM bench press, back squat (direct or Epley-estimated from ≤5 reps). Technique and depth standardized.
- Power: Vertical jump (Just Jump mat, arm swing allowed with strict landing), standing broad jump.
- Speed: 40-yard sprint on indoor turf with Brower electronic timing.
- Body mass via calibrated physician scale.
Analysis
- Linear mixed models with athlete as random intercept; estimated marginal means; Tukey-adjusted pairwise comparisons; Cohen’s d effect sizes to describe the magnitude of year-over-year change.
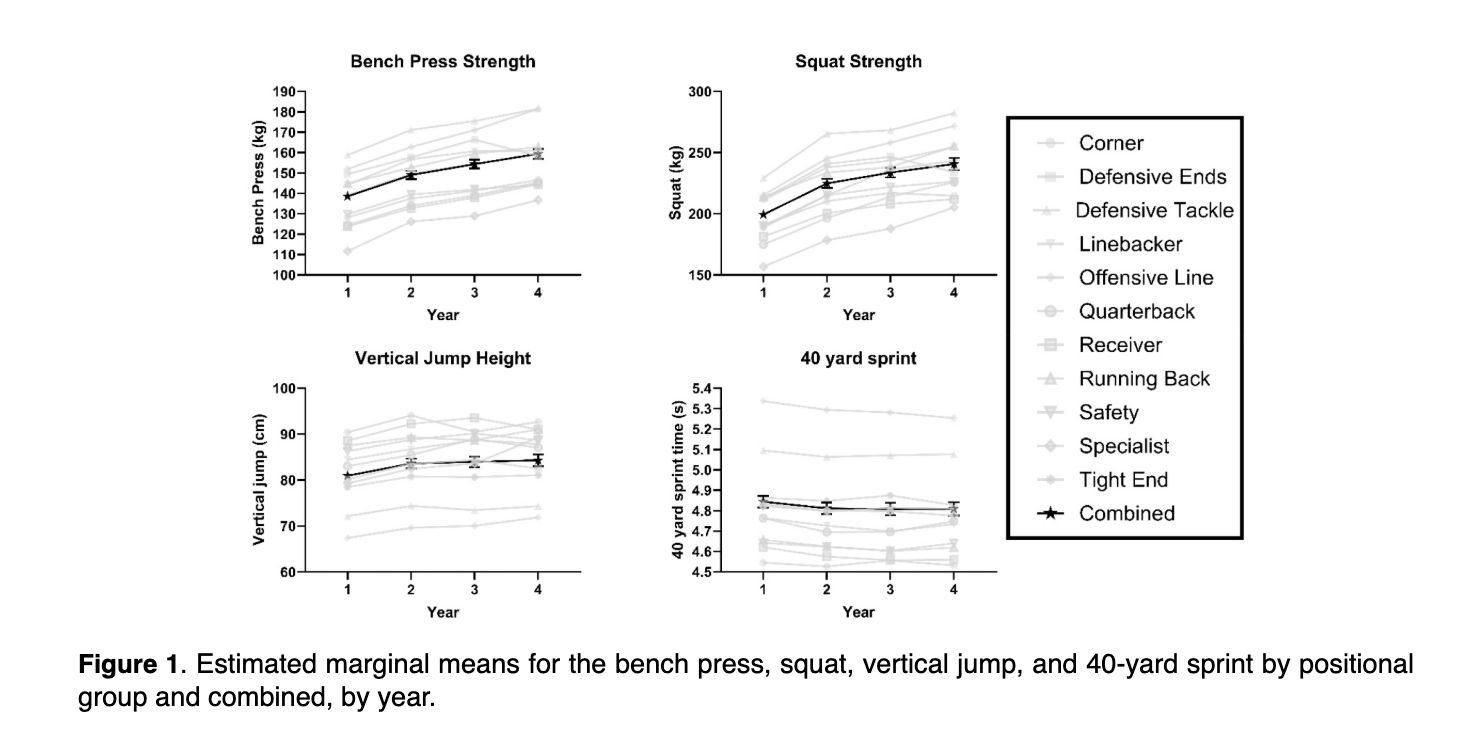
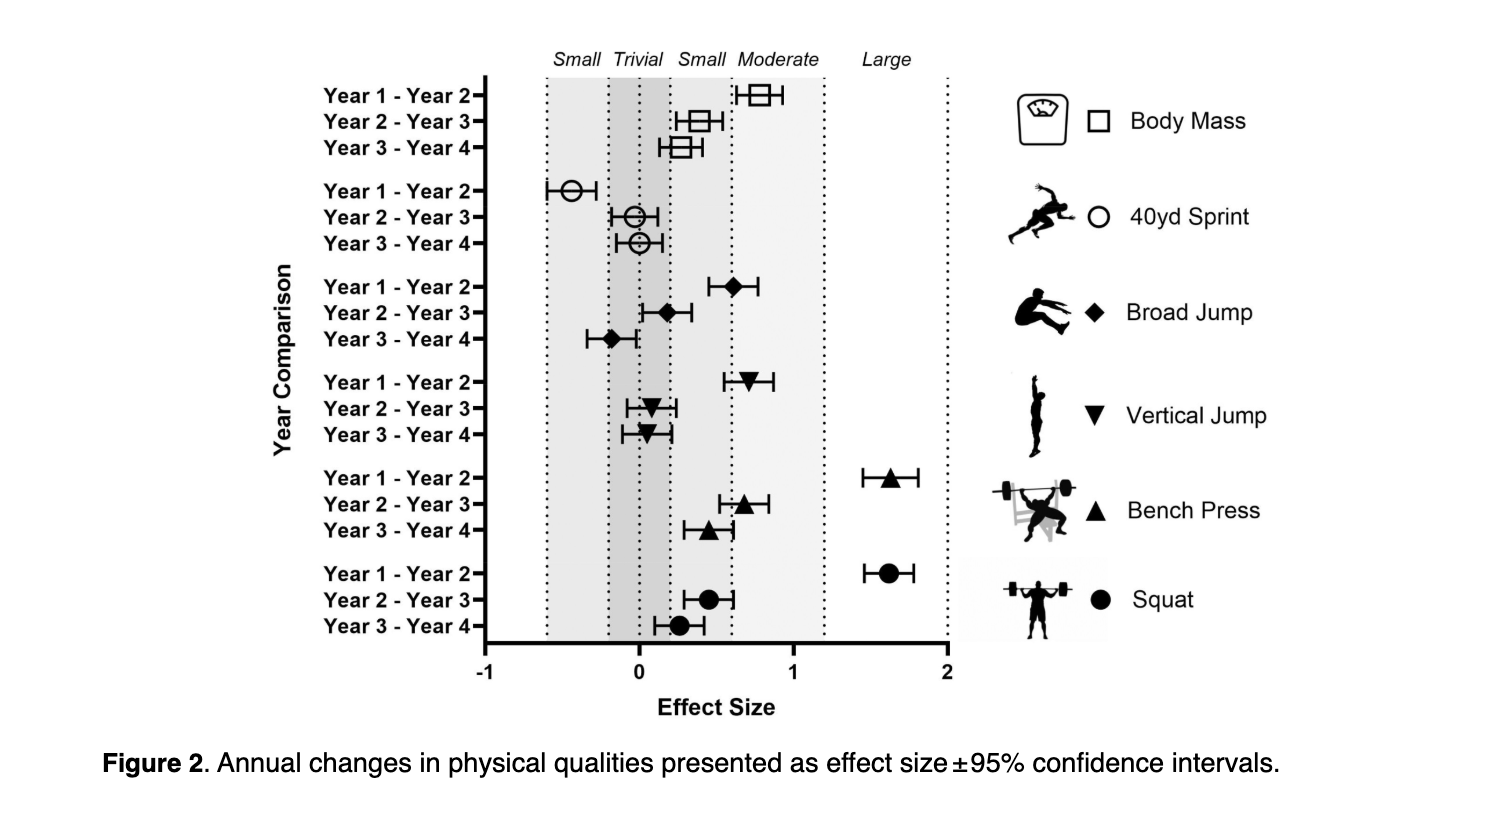
What were the results?
Big Progress Early
- From Year 1 to 2 across the entire cohort, effect sizes were large for bench (d≈1.63) and squat (d≈1.62).
- From Year 3 to 4, changes were only small (bench d≈0.45, squat d≈0.26).
Modest Improvements for Power and Speed
- Year 1 shows the most significant improvement in vertical jump, broad jump, and 40-yard sprint; subsequent years show progressively smaller gains.
Bigger by Year
- significant improvement in vertical jump, broad jump, and 40-yard, especially in line positions, with the largest increases early and smaller increments later.
- The cohort mass rose each year with a diminishing magnitude.
Positional Insights
- OL & DL: Highest body mass and absolute strength; slower sprint times; continued but tapering strength gains.
- WR/CB: Lightest, fastest, and best jumpers; still improve strength early but later gains are smaller.
- LB/TE/RB: Middle profiles; strong early gains in strength and modest improvements thereafter.
What Does This Mean?
Training Age Matters
- The first collegiate year offers the largest window for shifting the needle in strength and meaningful improvements in speed/power.
- Plan to front-load general development.
Expect Tapering ROI
- After Year 2, improvements occur, but at smaller magnitudes.
- Programs should pivot toward quality, specificity, and individualization rather than chasing linear load progressions.
Position-Specific Targets
- Use the positional trends to set realistic benchmarks and guide emphasis (e.g., OL/DL continue strength but manage mass; WR/CB refine speed and power qualities).
Limitations
- Single program data may limit generalizability across conferences or training philosophies.
- No in-season vs off-season split in analysis; we see yearly snapshots rather than microcycle influences.
Coach’s Takeaway
- Year 1 is critical for development ⮕ Prioritize robust full-body strength progression, foundational power work, and sprint mechanics.
- Expect smaller gains in years 1-2 ⮕ Focus on individual limiting factors, micro-dosed exposures, and sport-specific transfer.
- Benchmark by Position ⮕ Use the positional profiles to set targets and align body mass, strength, and speed goals with role demands.
I hope this helps,
Ramsey
Reference
Morrison M, Mann JB, Read DB, Thurlow F, Cowley N, Silverthorne K, McMahon E, Weakley J (2025). Longitudinal changes in strength, power, speed, and body mass in American football players: Diminishing returns as training age increases. International Journal of Sports Science & Coaching.


