

The countermovement jump (CMJ) is widely used to evaluate lower-body power, coordination, and rapid force development.
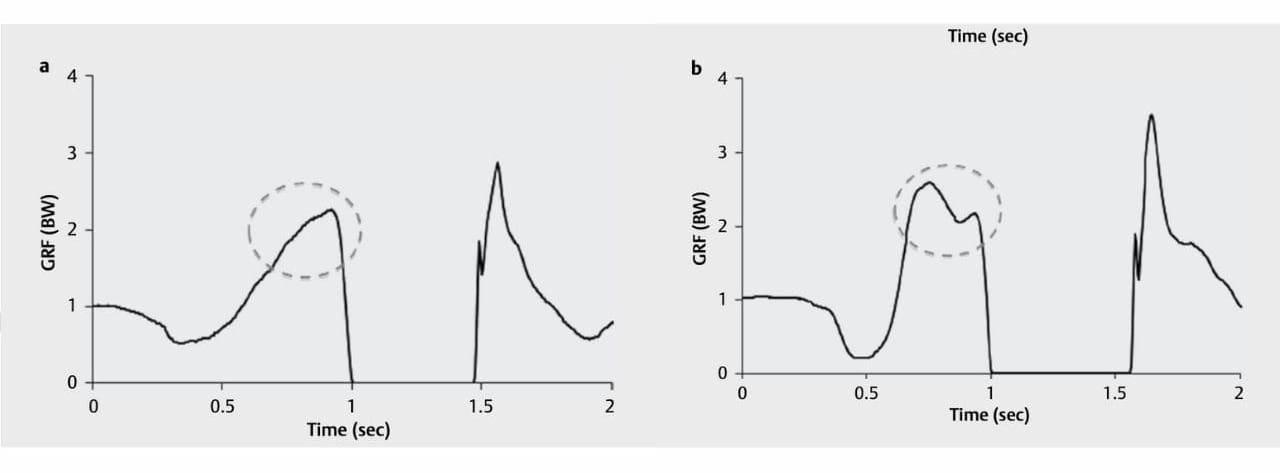
Ground reaction force (GRF) curves from CMJs can show either a single peak (unimodal) or double peak (bimodal) pattern.
This study explored how these two curve types differ biomechanically and what those differences reveal about athletic performance.
Does the type of force-time curve (unimodal vs. bimodal) during a CMJ reflect meaningful differences in jump performance, biomechanics, and coordination?
What Did the Researchers Do?
Researchers examined the differences between single-peak curve jumps (SPC) and double-peak jumps (DPC) using force plates and motion capture.
Participants
- 25 physically active college students
- Each participant performed three maximal-effort CMJs on dual force plates.
- GRF data was used to classify jumps as SPC (single peak) or DPC (double peak)
- Used 8 infrared cameras and motion capture with 19 reflective markers to analyze joint angles and timing
Of the 25 participants, 12 were in SPC group and 13 were in DPC group.
Measured Variables
- Jump height (JH), impulse, rate of force development (RFD), and reactive strength index-modified (RSIM)
- Joint kinematics (hip, knee, ankle angles and displacement)
- Joint kinetics (moment and power)
- Extensor concentric contraction timing (hip, knee, ankle)
What Were the Results?
DPC > SPC in Performance Metrics
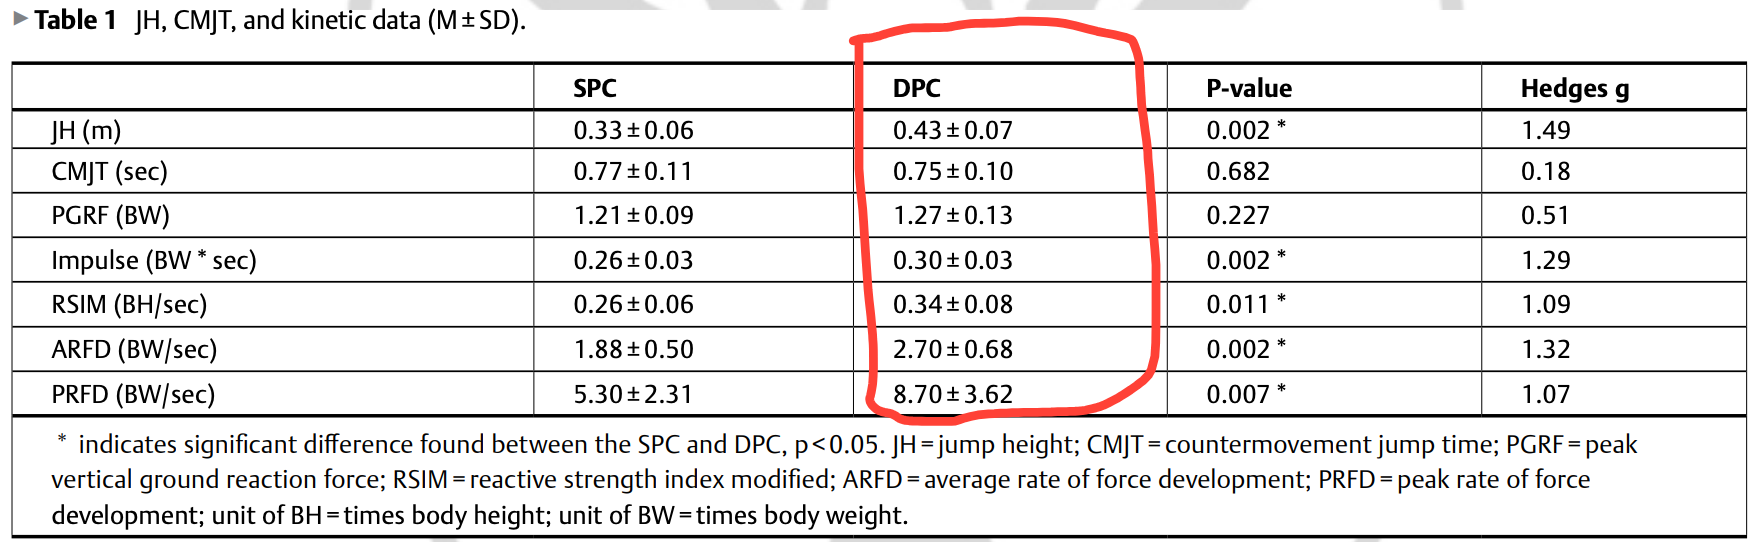
- Jump height ⮕ DPC = 0.43m vs. SPC = 0.33m
- Impulse ⮕ DPC = 0.30 vs. SPC = 0.26 BW·s
- Reactive Strength Index Modified (RSIM) and both average and peak RFD were significantly higher in DPC
Greater Joint ROM and Moments in DPC
- Greater hip and knee flexion angles in DPC
- Larger range of motion (flexion and extension) at all joints in DPC
- Higher hip and knee joint moments in DPC
Coordination Better in DPC
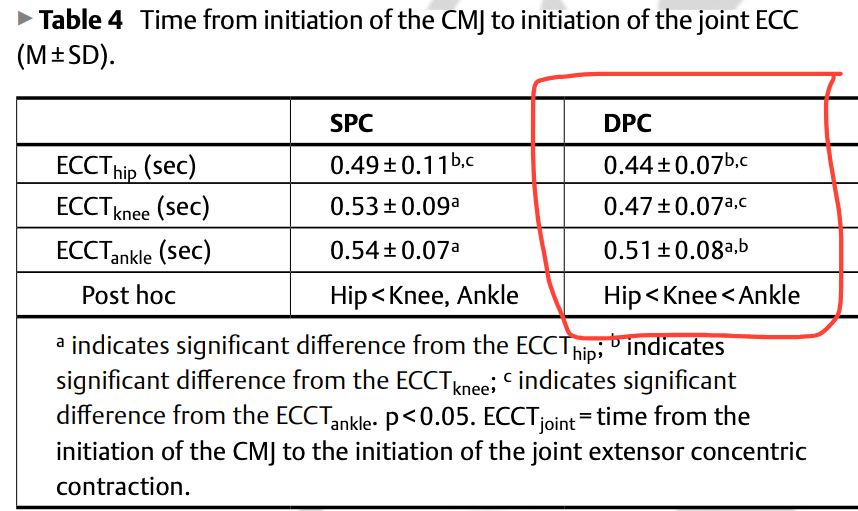
- DPC group followed a clear proximal-to-distal extensor activation pattern (hip → knee → ankle)
- SPC group did not show this organized sequencing
What Does This Mean?
- Athletes with DPC curves produce greater vertical impulse and jump height, suggesting superior strength and coordination.
- DPC pattern reflects more effective use of the stretch-shortening cycle and joint range of motion.
- Coordinated proximal-to-distal muscle sequencing in DPC may drive the second force peak, amplifying power generation.
Limitations
- Only the best jump was analyzed, not the average across multiple trials.
- SPC/DPC reliability across sessions wasn’t assessed and has been shown to be inconsistent across trials within subjects.
Coach's Takeaway
- Force-time curve shape matters ⮕ DPC is a biomechanical signature of better jumpers.
- Train sequencing and coordination ⮕ multi-joint exercises with a focus on hip-to-ankle power flow may help foster a more DPC.
- Assess GRF curves ⮕ use CMJ testing to not just outputs outcomes (height) but evaluate how your athletes produce force.
Reference
Peng HT, Song CY, Chen ZR, Wang IL, Gu CY, Wang LI. (2019). Differences Between Bimodal and Unimodal Force-Time Curves During Countermovement Jump. International Journal of Sports Medicine, 40(8), 663–669


